

Calculating the Mean and Median of a Data Set
Question:
Data from 20 customers’ feedback on the services of three employees at a company with scores ranging from 1 to 10 are as follows:
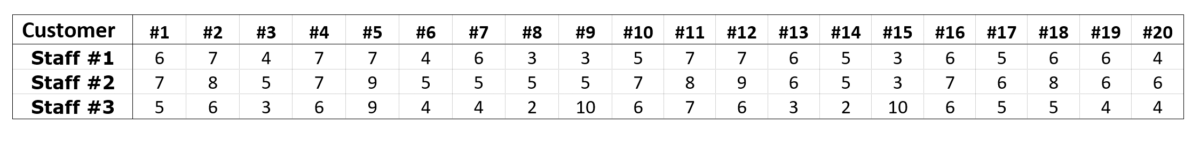
Calculate the median and the mean of each data set. Provide comments on each employee’s performance.
Answer:
The median and mean are measures of central tendency. Each summarises the main feature of a data set.
Let  be the data set,
  , then its mean is its average value,
  , which is calculated as

Median is the value in the middle of the data range; therefore, to compute the median the set has to be sorted into an ordered list first, then the value at the middle of the range is the set’s median. A general formula for finding median of an ordered data set  is
is


where is the ordered list of data set
Calculations
Let  ,
,  ,
,  be score sets of employee #1, #2, and #3, respectively, using Eq. (1), the respective mean of the three data sets are

To calculate the median, these data sets are sorted into order lists  ,
,  ,
,  , respectively as shown in Table 2.

Median of set #1 is

Similarly, median of set #2 is 6, and set #3 is 5.
Comments
Set #1 and #2 have the same median value (6) despite employee #2 having better scores overall, which is reflected in the higher mean score value of 6.35.
Employee #3 received equal or lower scores than those of employee #1 in 17 out of 20 entries, therefore, had lower median (5), but thanks to 3 extreme scores (9 and 10) the mean values of the two sets are the same (5.35). Table 1 shows that while customer #5 could be seen as generous by giving high scores for all three employees, customers #9 and #15 show clear favor to employee #3. Unlike the median, the mean is greatly affected by extreme scores. On the other hand, the median alone may not reflect the true quality of the inspected data.
Extra Notes
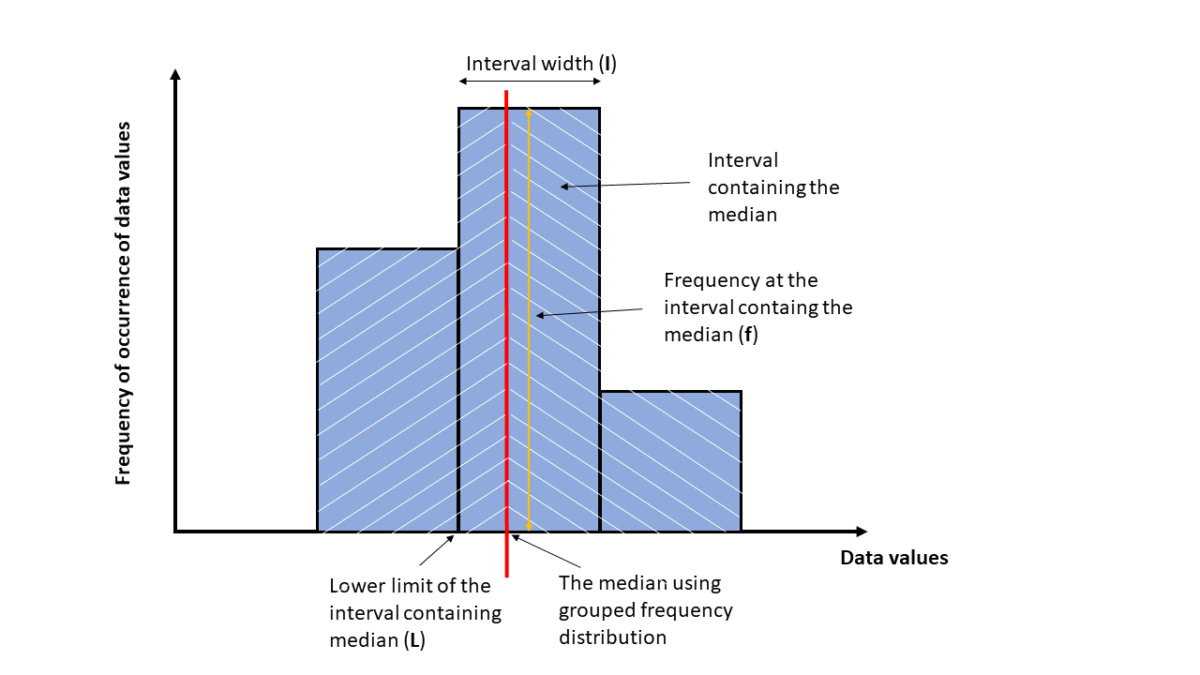
A more meaningful way to compute the median is to consider the area under the graph or distribution of the data series, such that the line through this median divides the area exactly in half. This method of calculating the median is for continuous data series or grouped data sets but can be applied for other types of data series in general. The formula to calculate this median is

where
- L = lower limit of the interval containing the median
- I = width of the interval containing the median
- N = total number of data
- F = cumulative frequency at the lower limit of the interval containing the median. Cumulative frequency is the sum of all frequencies less than a reference value in a frequency distribution
- f = the frequency at the interval containing the median.
The meaning of these symbols is illustrated in the following graph:
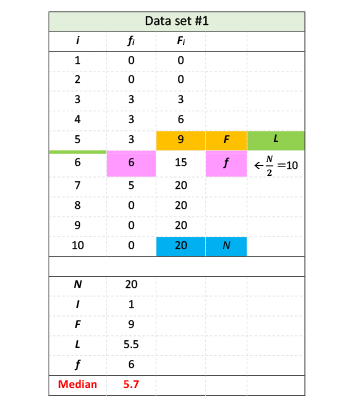
Let’s apply Eq. 3 to find this new median for data set #1.
First, we calculate frequency  and cumulative frequency
  for each score
  (see Table 3)
The total number of data is 20, therefore  20
20
The median is at the middle of the data list, that is at position  10, therefore, the interval at
  15 must contain the set’s median (colored in pink). Frequency
  is in this interval and equal to 6.
 is the value before = 15, therefore,
  9
9
Scores are 1, 2, 3, … 10, therefore  (the width of the interval containing
  6)
6)
In this exercise the interval for plotting score is [ 0.5,
0.5,  0.5] and value is the middle point of the interval, therefore,
  (the lower limit of interval = 6) is 5.5.
Substitute these values into equation Eq. 3 we have

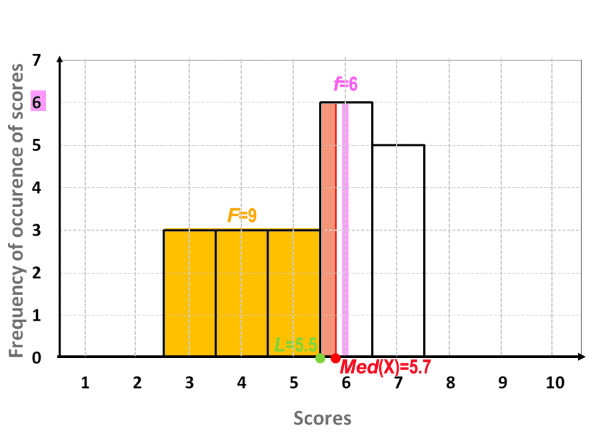
The median of data set #1, and intermediate calculations are shown in Table 3; a visual presentation of these values are shown in Figure 2.
The medians of data set #2 and #3 can be calculated similarly, and results are shown in Table 4
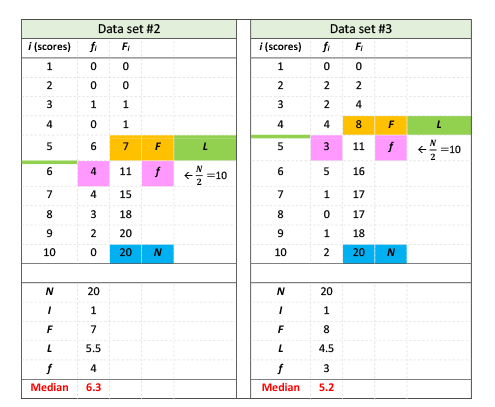
Using this method, the medians for set #1, #2, and #3 are 5.7, 6.3 and 5.2, respectively, which reflects a more accurate perspective of the three sets.